Getting Started
An introduction example for new pygeostat users is provided Introduction
This introduction assumes familiarity with standard scientific computing packages in Python:
pandas for data management (https://pandas.pydata.org/pandas-docs/version/0.22/10min.html)
numpy for mathematics (https://numpy.org/devdocs/user/quickstart.html)
matplotlib.pyplot for plotting (https://matplotlib.org/tutorials/introductory/pyplot.html)
Pygeostat users are encouraged to read the linked introductions to theses packages if unfamiliar with them, as pygeostat builds on their functionality.
A series of introductory tutorials to begin learning Python (https://docs.python.org/3/tutorial/index.html)
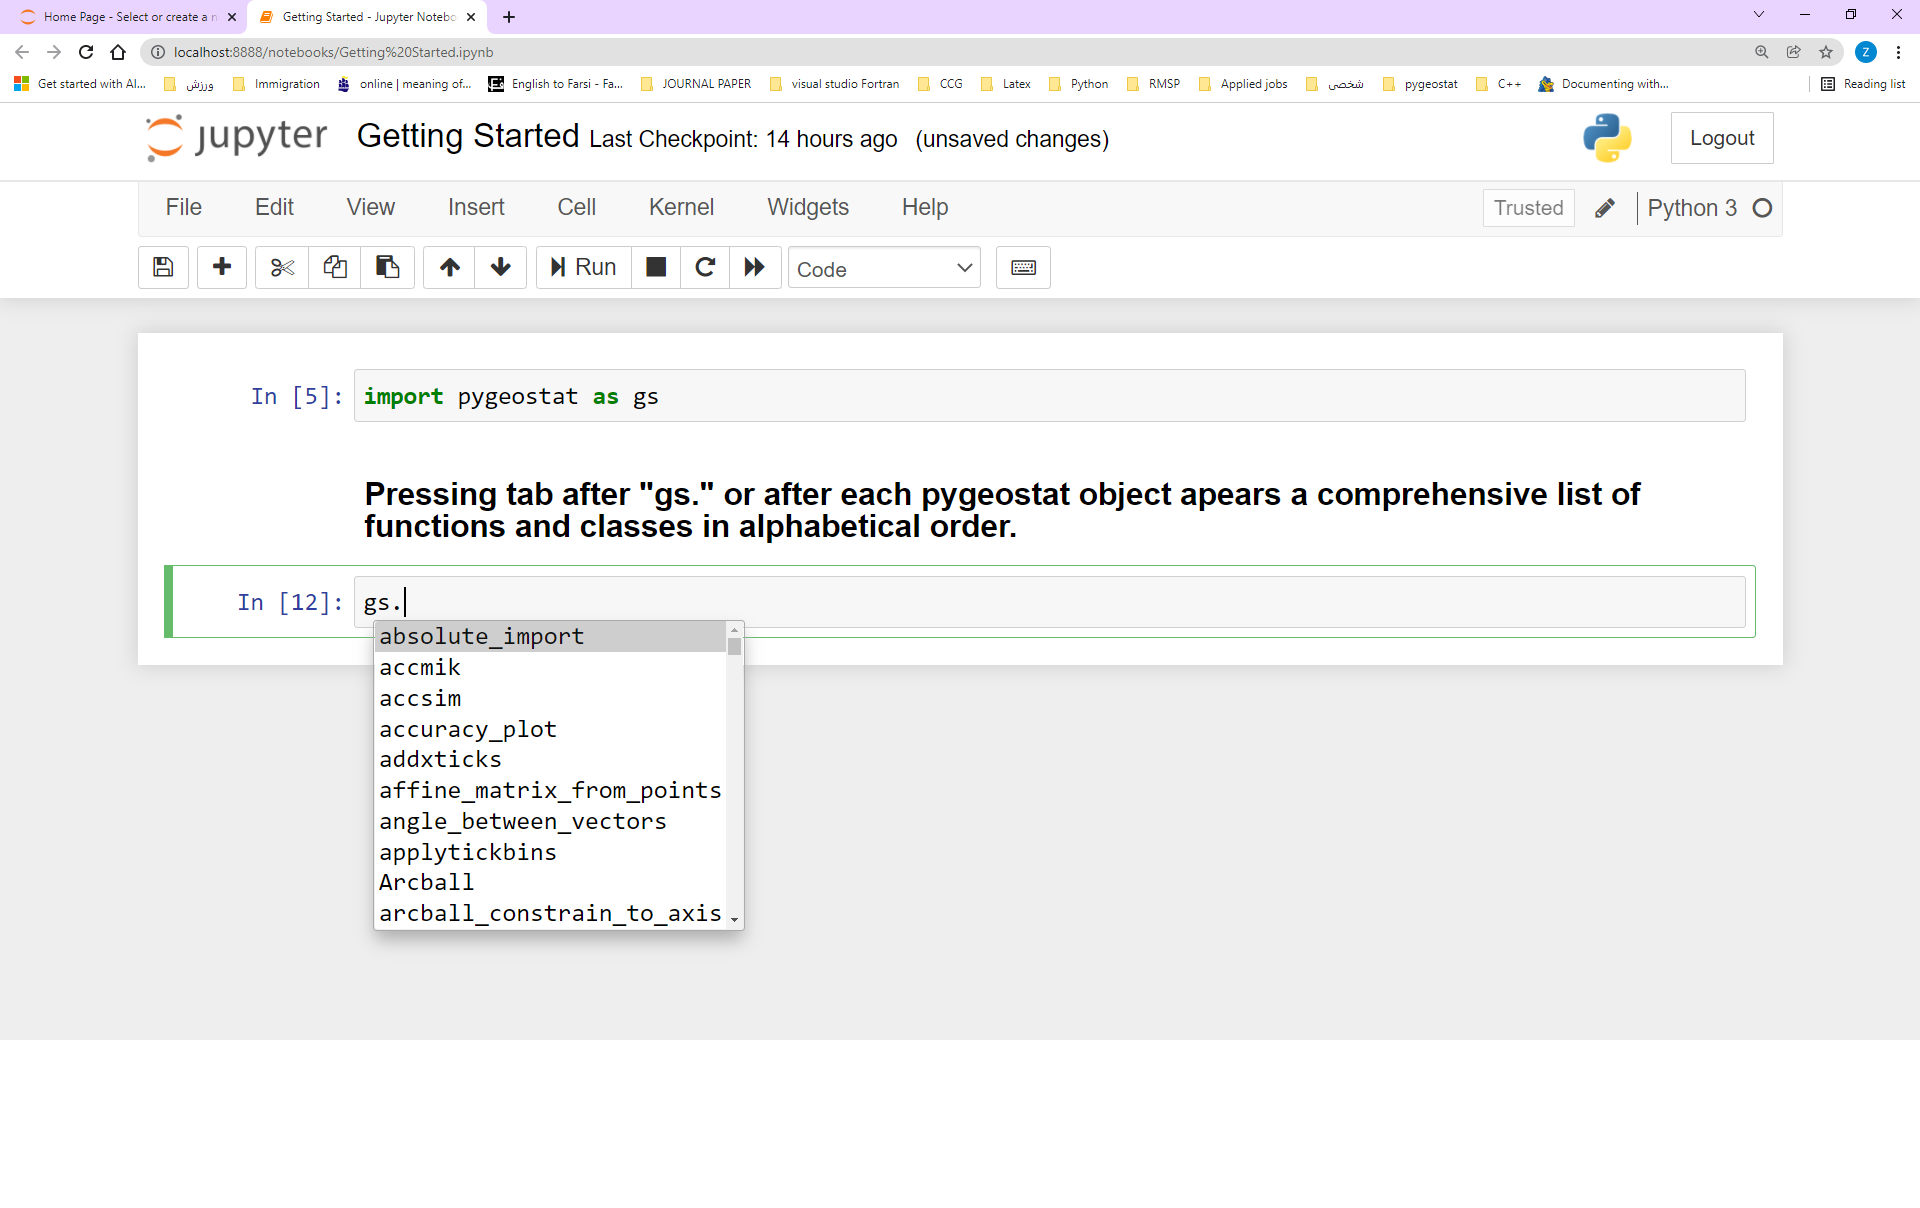
A comprehensive list of pygeostst functions and classes is available at Index
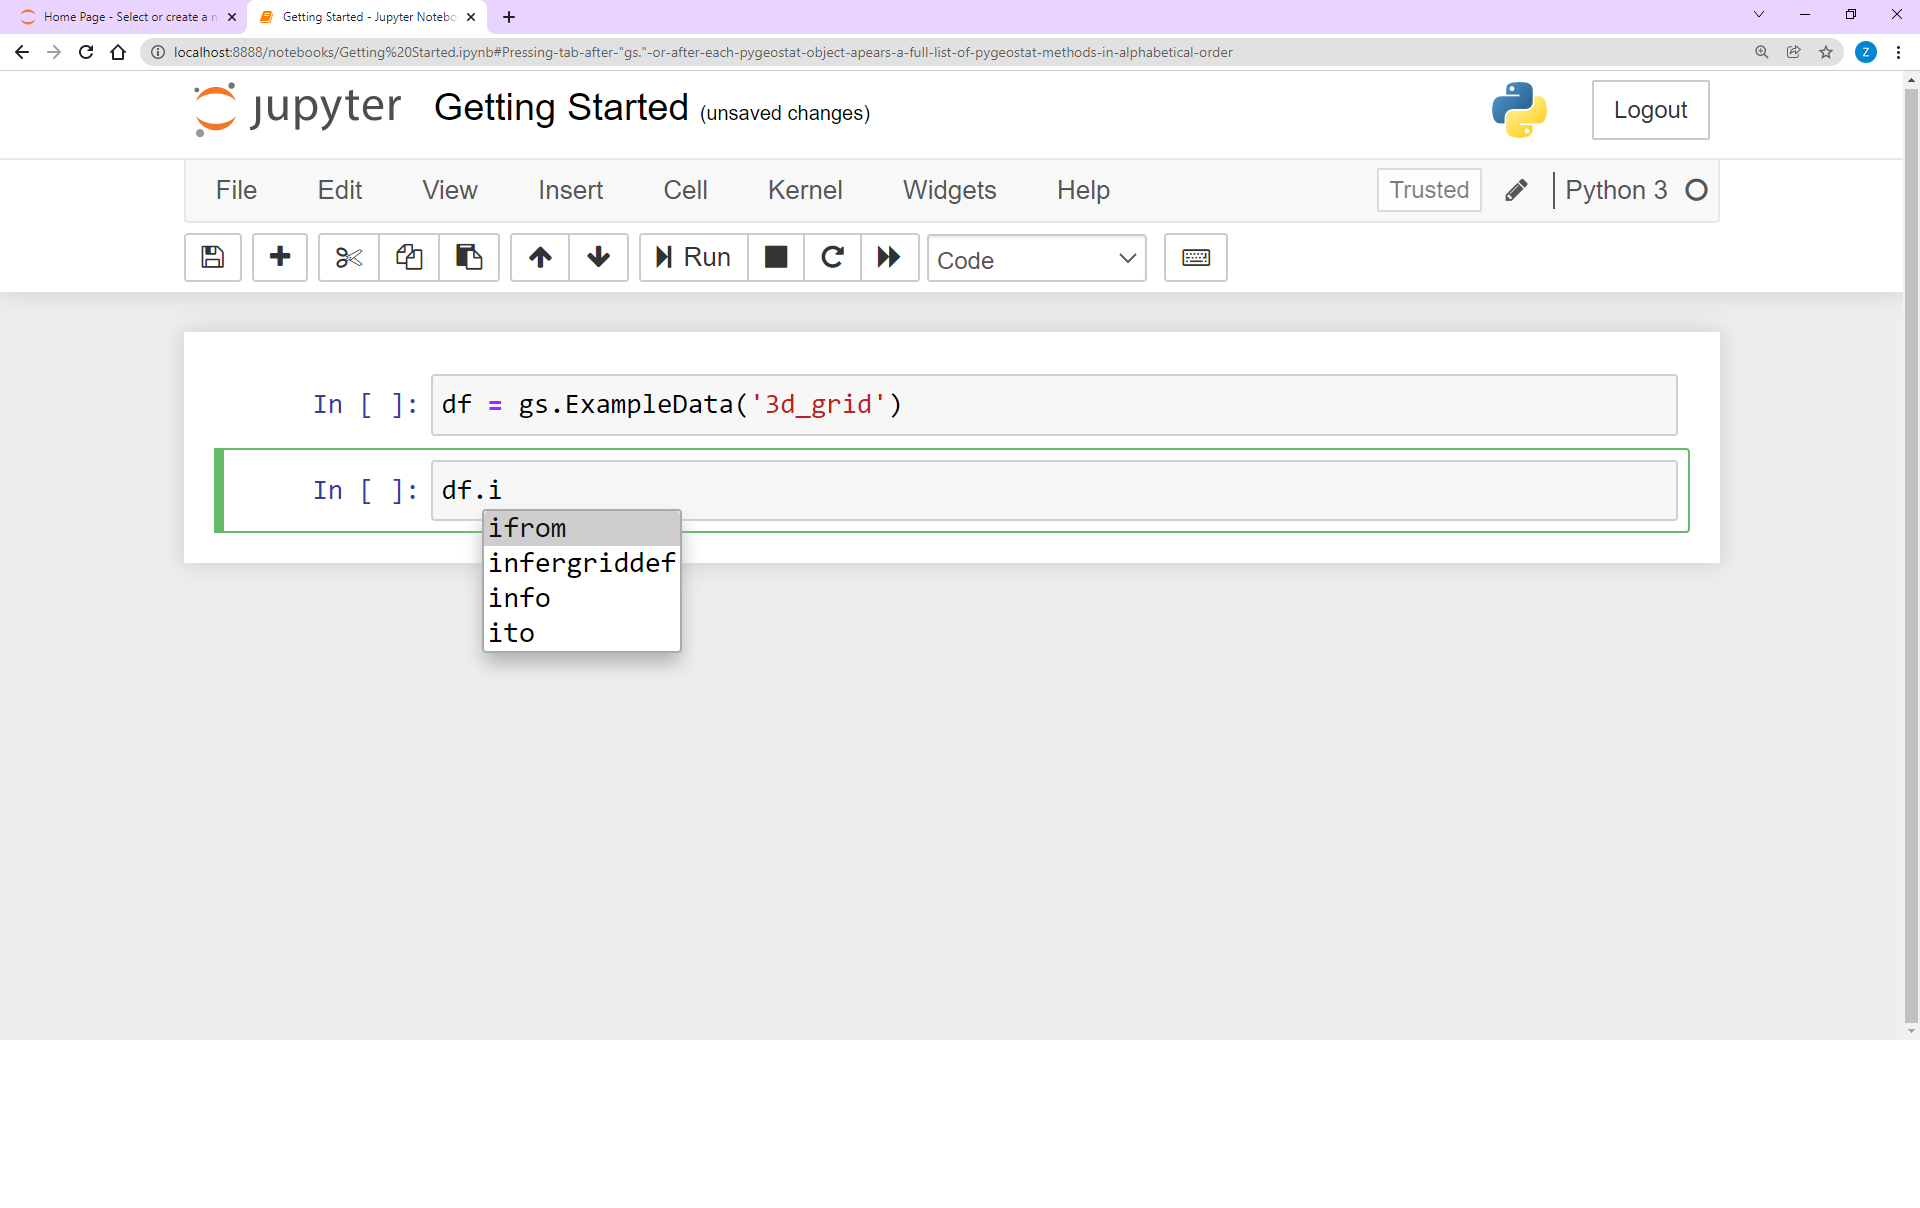
The list of pygeostst functions and classes can also be accessed as shown below,
- Some Exapmles of using Python standard libraries for resource modelling:
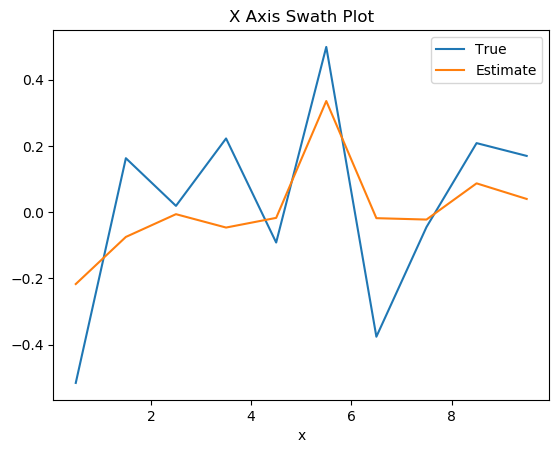
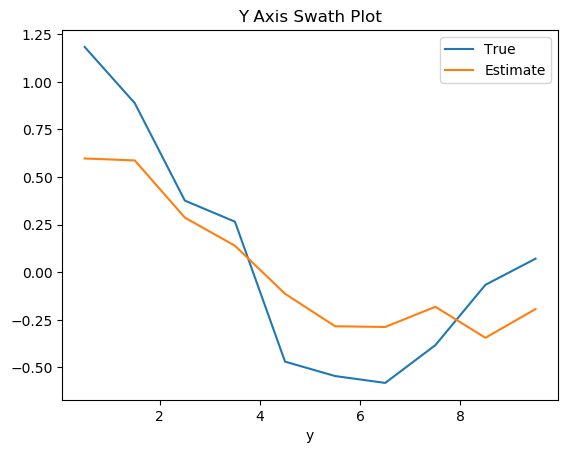
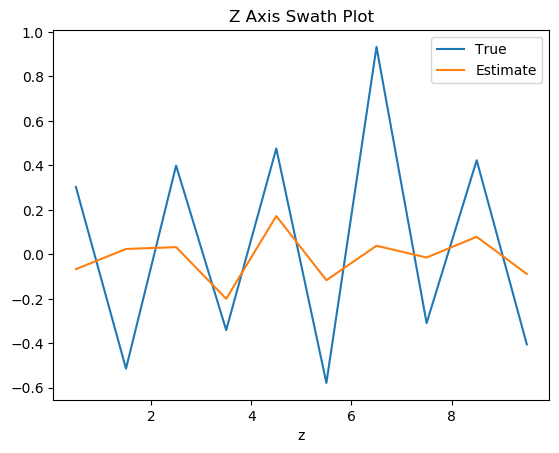
Swath plot:
import pygeostat as gs
datafl = gs.ExampleData('3d_estimate').data
data = datafl[['x', 'y', 'z','True', 'Estimate']]
# swath plot
for orient in ['x','y','z']:
   swath = data.groupby(orient)[['True', 'Estimate']].mean()
   swath.plot(title = f'{orient.upper()} Axis Swath Plot')