Welcome
Welcome to pygeostat, a Python 3.6 module for geostatistical modeling. pygeostat is aimed at preparing spatial data, scripting geostatistical workflows, modeling using tools developed at the Centre for Computational Geostatistics, and constructing visualizations to communicate spatial data.
Features:
- Configurations of persistent project parameters and plotting style parameters
- Data file management functions for interacting with CSV, GeoEAS (GSLIB), and VTK formats
- Utilities for managing GSLIB-style grid definitions
- Export gridded and point data files for visualization with Paraview (VTK format)
- Simplified scripting of gslib programs with parallelization and crash detection/notification
- Linear desurveying and compositing methods including automatic composite detection
- Fast, accurate variogram calculation, model fitting and modeling routines
- Vast library of plotting functions
Indices and tables
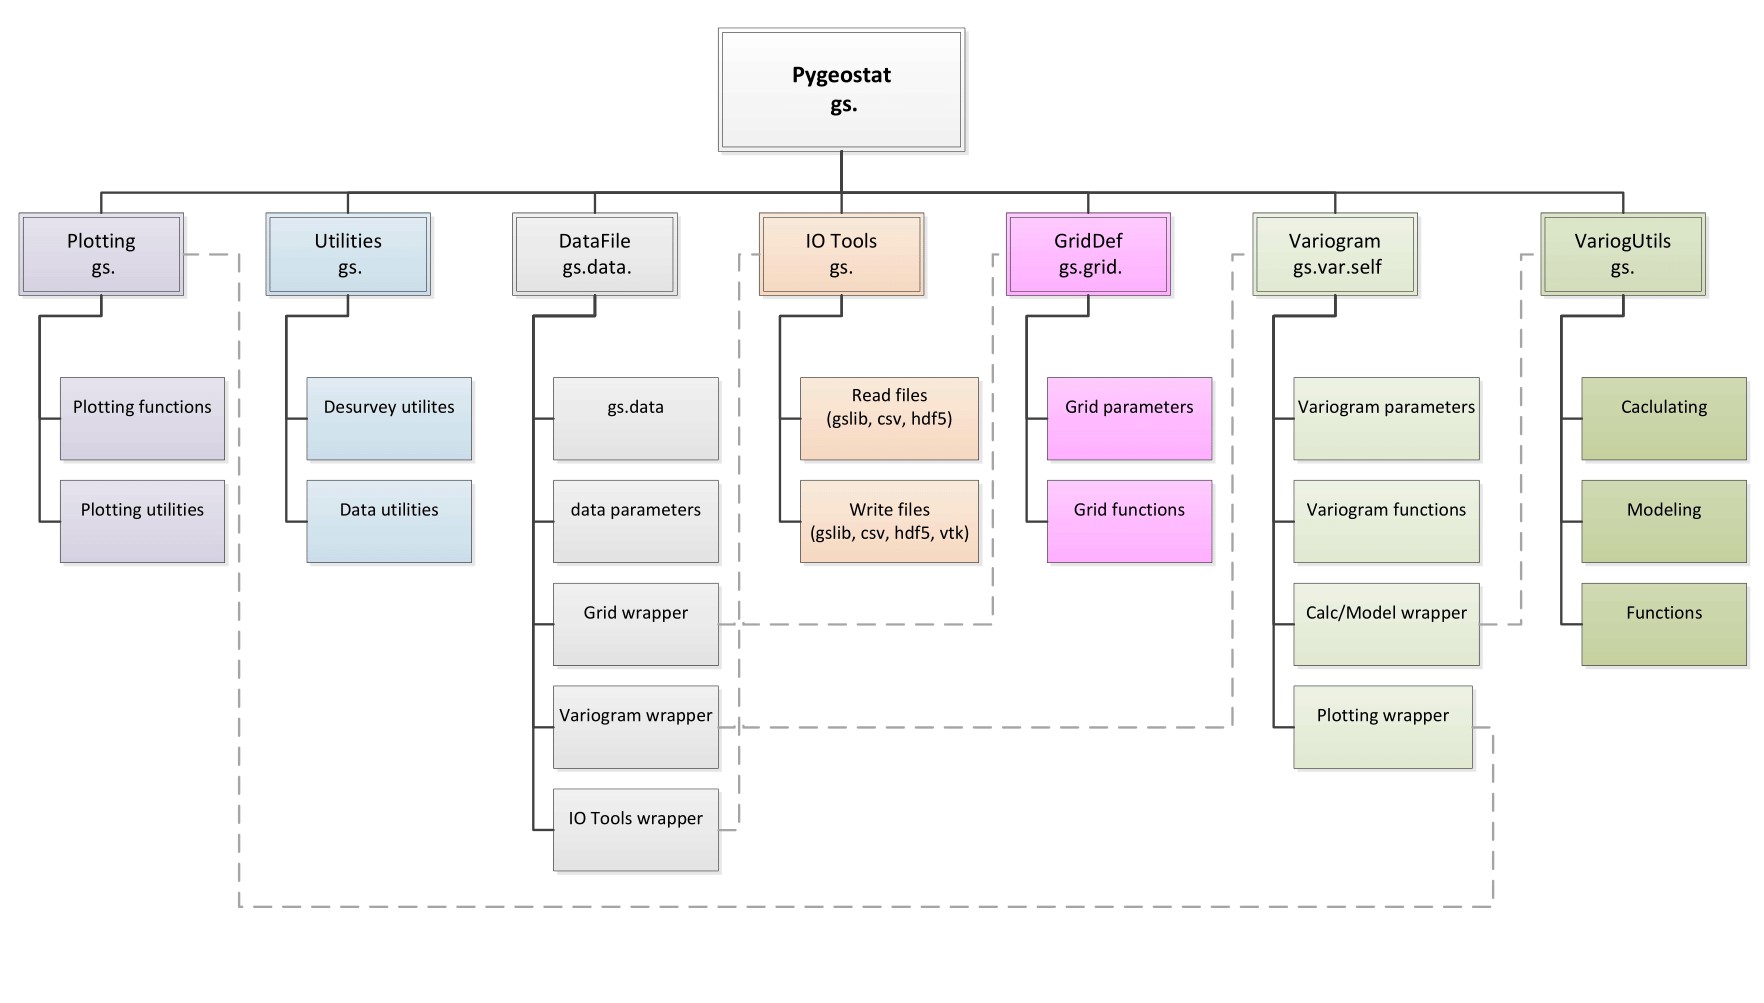
General Package Overview
The pygeostat package is designed with a flat methodology that uses wrappers to tie some of modules and functions together The following figure shows a general layout of the pygeostat package.
Plotting Gallery
corrmat
pixelplt
scatxval
pitplt
accplt
varplt
pixelplt
varpltsim
histpltsim
histplt
histplt
loadingsplt
Terms of Use
pygeostat is licensed under the CCG Terms of Use, which may be found at the below link. http://www.ccgalberta.com/software-terms-of-use/
Change Log
Version 0.1 (2015-11-16)
- Changes not tracked
Version 0.2 (2016-01-28)
- Changes not tracked
- Python 2.7 compatibility
Version 0.3 (2016-09-13) Current Stable Branch
Python 2.7, 3.4, 3.5 compatibility
Fortran Module for reading and writing data fast
- Read_point data module (data size unknown)
- Read_grid data module (griddef passed for data size)
- Write array fast (using real format)
New plotting functions
Simulation accuracy plot
Global visualization plot (i.e., trend plot/global kriging plot)
- Generate a global visualization model as a plot and/or data
Location map plotting
Probability plot
Image grid plotter
MDS plotting
KDE Plot
Drill plot
Miscellaneous plotting changes:
Gridslicer
- Revamped subplotting method and added super axis labels and a super title
Colormaps ‘viridis’, ‘inferno’, ‘plasma’, and ‘magma’ are now available through matplotlib version 1.5.1. Their data has been removed. The function get.get_cmap() remains for backwards compatibility and gets the required data from mpl if called.
Many steps are now modularized
Colorbars and colormaps (gs.color_handling_gridded)
Setup plots (gs.setup_plot)
Plot labels (gs.plot_labels_gridded)
Format and Rotate tick labels (gs.format_tick_labels)
Add a scale bar (gs.scalebar)
find smart annotation locations (gs.smart_annotate): works ok
extract stats on data and create statblock (gs.get_statblk)
HDF5 data file format functionality
Can now use HDF5 file formats within pygeostat using both a fortran and python implementation. pytables HDF5 format is no longer supported. Now using h5py.
Enhanced HDF5 file functionality within the following plotting functions:
- gs.histpltsim()
- gs.Variograms.varsim()
GSB functionality now available for file IO
- requires realization number (assumed to be 1)
- requires trimming variable for indicator compression
- assumes all variables are double precision floats
GIS functionality
ArcPy class that stores common parameters, a pipe to ArcPy, and wrappers of various ArcPy functions.
Shapefile class
- Provides IO tools for attribute tables within python
- Polygon shapefile plotting functionality
Raster class
- Provides IO for ESRI ASCII raster files
- Conversion tools to and from GSLIB grid and ESRI ASCII rasters
pygeostat F2PY Compiling Function
- command line or within-python Fortran extension compiling
- permits building F2PY modules for all (2.7, 3.4 or 3.5) python versions
- Bare minimum requires MinGW
- Intel compiler requires some extra libraries
Normal score transformations
- Both forward and backward transformations are available within pygeostat
Miscellaneous new functions:
- Super-secondary calculation
- KDE
- MDS
- Likelihood
- postsim for separate files
Miscellaneous enhancements:
Variogram class
- Multiple files each containing a realization are now accepted in the Varsim workflow.
New 2-D function to calculate idx and idy needed for varsim gs.get_varsimpars_2d()
Miscellaneous bug fixes:
- gs.get_varsimpars(): The returned indexes were wrong for azimuths in the ranges of (90, 180)and (270, 360)
- gs.VarSim(): Now outputs correct azimuths. Would get negative values at times
- gs.Variogram: Now correctly plots modeled 3-D variograms correctly
Version 0.4 (n.d.) Unreleased Dev Branch
Scripting
Report Progress for Parallel Processing with a html widget
Tab-indent parfiles in scripting workflows to allow folding and better organization
ScriptNotifier Class
- email or text yourself with updates from script or if error occurs
Fortran IO module
- Modular handing of a formatting string to reduce whitespace where float arrays contain integer columns
- Supporing more types for writing, Single, Double, Integer
pyGSB
- Added a function to split realizations
- GSB backend updated to V4.00
Pygeostat Compile Fortran pyd Function
- Automatically builds a lapack library for the target compiler
- Added the ability to
wraponlysome functions in the fortran code
HDF5 improvement
- Writing out realizations may consider a keyout array
- Writing files with data and attributes of the project
- PostSim large files by iterating through an h5 file with a chunksize
Modularize Common Plotting Components
- Colorbars and colormaps
- setup plots
- plot labels
- rotate tick labels
Plotting
Modularize Common Plotting Components
- Colorbars and colormaps
- setup plots
- plot labels
- rotate tick labels
Quantity of Metals Plot
Quantile-Quantile Plot
Drill hole plotting function
- Better handling of collar locations
Statistics
- Smooth a CDF
- Discretize a CDF
- Variance from CDF
Variograms
update_calcpars,update_modelpars,update_simparsfunctions have keyword arguments for guidance during interactive variogam parameterization- Bugfixes for
inferdirectionslogic for a 3D case where tilt is involved - Plot the number of pairs for each experimental variogram point
- Write out the formatted variogram model with the variogram plot
- varsim updated to v1.4
GridDef additions
- Indexes of one griddef in another griddef
- Realization index functions
- Outline points of grid
- Pad a griddef
- Find a subgrid spanning a dataset
DataFiles
- Check for duplicate columns and rename them accordingly
- Checks on attributes of the datafile
Data Utilities
- Desurveying updates
- Parallelized version
- Fast Compositing
Bug fixes, updates
Version 0.5 () Current Dev Branch
A new DefaultPlotSettings class has been added, which sets, saves and loads matplotlib defaults (matplotlib.rcParams) for a notebook, project, system, etc.
- Preset styles may be loaded, providing added convenience and allowing for backwards compatibility with the previous ccgpaper default
- Using pygeostat plotting functions no longer makes permeant changes to the matplotlib default settings (unless requested)
- pygeostat/dev_testing/demos_current/set_style_demo.ipynb (here) provides a detailed demo of the changes
A new gsParams class has been added, which sets, saves and loads pygeostat defaults on a notebook, project, system, etc.
- No settings that directly relate to matplotlib.rcParams are found in this class, as the two classes compliment each other
- pygeostat.gsParams.describe() provides a detailed description of all present defaults and their application across pygeostat
- This impacts settings such the use of a grid by default in plots, the color of variograms, the trimming limits and null values of a project, the grid definition and number of realizations for a project, the categorical dictionary and colormap, etc.
- pygeostat/dev_testing/demos_current/gsParams_demo.ipynb (here) provides a detailed demo of the changes
New functionality and attributes have been added to the DataFile class
- New functions include a data spacing calculation and an improved infergriddef function
- Frequently used pandas.DataFrame functionality is now applied directly to DataFile, such as get/set item, drop, rename etc., removing the frequent appearance of ‘data.data’ in scripts. Using these extended functions are considered best practice (rather than the DataFrame equivalent), since DataFile attributes that are external to the DataFile.DataFrame are modified as necessary.
- New attributes include variables, cat and catdict, which are heavily integrated for convenience in functions such as pixelplt, locmap, histplt, scatplt and the new categorical module.
- More minor, but nevertheless convenient attributes include nvar, xyz, columns, shape, etc.
- pygeostat/dev_testing/demos_current/DataFileUpdates_demo.ipynb (here) provides a detailed demo of the changes
- see also: pygeostat/dev_testing/demos_current/weights_demo.ipynb (here) for additional improvements to the datafile
The write_vtk function has been updated, provided additional flexibility and efficiency
- All output formats are binary, writing faster from Python and reading faster into Paraview
- The binary precision of coordinates and variables may be specified
- Structured grids and surfaces may be output through use of the dftype=’sgrid’ option, which requires that the passed data include at least one column with irregular coordinates
- pygeostat/dev_testing/demos_current/vtk_demo.ipynb (here) provides a detailed demo of the changes
The Griddef class has been updated, providing additional functionality, explicit naming and computational speed
- Functions have been renamed to be more explicit and use correct Python convention
- Nearly all grid functions now operate with scalar or vector inputs, providing large computational improvements since loops can be avoided
- pygeostat/dev_testing/demos_current/GridDefUpdates_demo.ipynb (here) provides a detailed demo of the changes
A new categorical module provides new functionality, including classes relating to proportions, transition probabilities and the hierarchical truncated pluriGaussian (HTPG) simulation workflow
- The HTPG object allows initializes and plots a truncation mask, before applying every step of the HTPG workflow in a streamlined manner that integrates several pygeostat conveniences (this object is still in development regarding potential options and inputs)
- The Proportion object calculates and plots categorical data proportions, while also facilitating the checking, correction and plotting of simulated proportions
- The TranitProb object calculates and plots transition probabilities, while also calculating and plotting related dissimilarity matrices and multi-dimensional scaling (MDS) mapping
- The mergemod function merges realizations of continuous variables that are simulated by category (emulates the CCG mergemod program)
- The catdict (gsParams setting and DataFile attribute) and cmap_cat (gsParams setting) are heavily leveraged across this module for added convenience
A scatplt function has been added, which mimics the GSLIB scatplt program in terms of its options (e.g., weighted statistics)
- This also provides convenient functionality such as KDE calculation/coloring
- The scatplts and scatplts_lu wrappers allow for multiple scatterplots to be plotted and compared
- pygeostat/dev_testing/demos_current/scatplt_demo.ipynb (here) provides a detailed demo of the changes
Fortran functions have begun being updated with the latest core routines, such as gslib_binary, varsim, etc.
- New Fortran functions have also been updated, such as a structured grid vertices routine that is called by write_vtk
- Remnant Fortran bugs from previous builds have been identified and fixed (GSB and variogram modeling related)
- An improved compile.py approach improves the build stability across different windows machines
- Pygeostat distribution with compiled source code now follows standard
pip wheelformats
To align with matplotlib/numpy/pandas/scipy/paraview, etc. functionality, all import tools now convert trimmed values to NaN
- All calculations handle NaN values intrinsically as null, thereby removing the need for tmin-type arguments
- All output functions replace NaN values with a specified null value
- The default assignment of NaN, null values, etc. can be altered with kwargs or gsParams
In Development
Consistent leveraging of the DataFile, GridDef and gsParams objects across all plotting functions
- Initial development has focused on histplt, locmap, pixelplt, scatplt and the categorical functions
- Additional attention is required for the remaining functions to provide similar performance
Further modularization of plotting routines (effort has been made, but additional work is required)
Testing/re-implementation of functions with the new standards
- Some routines are maintained, but not imported by Pygeostat until additional testing can be completed
- This includes the desurvey module (immediate priority) and gis module
Wishlist Functions
- gs.writefile() - make similar to gs.readfile()
- gs.scatnscore() - bivariate gaussian test
- calc/fit variograms in parallel (Working prototype(s) available)
- Plotting Functions
- q/q plot needs some love (docs and what not)
- Orientation (vector slices)
Lessons / Examples
- Go through all and fix to current pygeostat coolness
- Paraview scripting example
- GIS I/O
- Cannot create shapefiles from scratch in pygeostat yet. gs.Shapefile.writefile() function almost done